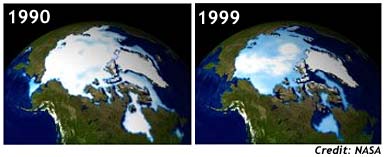
These two images show Arctic sea ice extent from January 1, 1990, and January 1, 1999, respectively. These images were created using data from the Defense Meteorlogical Satellite Program’s (DMSP) Special Scanning Microwave Imager (SSM/I). Credit: NASA
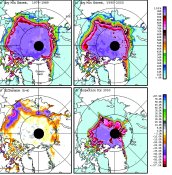
Perennial Ice
Title for Fig. A: Average Perennial Ice Concentrations from
1979 to 1989
Credit: J.C. Comiso, NASA/GSFC and Rob Gersten, SSAI
Caption: This figure represents the average concentration of Arctic perennial
ice cover using data derived for each year from 1979 to 1989. Perennial sea ice
floats in the polar oceans and remains at the end of the summer, when the ice
cover is at its minimum and seasonal sea ice has melted. This year-round ice
averages about 3 meters (9.8 feet) in depth, but can be as thick as 7 meters (23
feet). The color bar represents percentages of sea ice within each satellite
grid.
Title for Fig. B: Average Perennial Ice Concentrations from
1990 to 2000
Credit: J.C. Comiso, NASA/GSFC and Rob Gersten, SSAI
Caption: This graphic shows the average concentration of Arctic perennial ice
cover for each year from 1990 to 2000.
Title for Fig. C: The Difference in Sea Ice Concentrations
Credit: J.C. Comiso, NASA/GSFC and Rob Gersten, SSAI
Caption: This image represents the difference in sea ice concentrations between
the first 11 years (1979 to 1989) and the second 11 years (1990 to 2000) of
perennial ice cover data. The color bar shows the difference in percentages from
the earlier period to the latter. The biggest decline occurred in the western
area (Beaufort and Chukchi Seas) while considerable losses were also apparent in
the eastern region (Siberian, Laptev and Kara Seas). Also, the perennial ice
actually advanced in relatively small areas, especially near Greenland.
Title for Fig. D: Projection for the Perennial Ice Cover in
2050
Credit: J.C. Comiso, NASA/GSFC and Rob Gersten, SSAI
Caption: This image represents the decadal average of the concentration of the
perennial ice cover during the 2050s as projected from the current data set.
This map was developed assuming a linear decline following the decadal change
from the 1980s to the 1990s. Credit: NASA
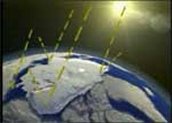 Albedo
Ice reflects light from the sun. As polar ice caps melt, less sunlight gets reflected into space. It is instead absorbed into the oceans and land, raising the overall temperature, and fueling further melting. Credit: NASA
As the ice melts, the Arctic waters will begin to warm. With less ice to reflect
the sun's rays back into space, the ocean will absorb more of the sun's heat.
Eventually, the melting will be become irreversible.
|