Human Role in Global Warming Unequivocal, Say World's Meteorologists
DURBAN, South Africa, November 29, 2011 (ENS) - Global temperatures in 2011 are currently the 10th highest on record and are higher than any previous year with a La Niña event, which has a cooling influence. The 13 warmest years have all occurred in the 15 years since 1997.
The extent of Arctic sea ice in 2011 was the second lowest on record, and its volume was the lowest.
These facts are drawn from the provisional annual World Meteorological Organization Statement on the Status of the Global Climate, which gives a global temperature assessment and a snapshot of weather and climate events around the world in 2011. It was released today at the United Nations climate conference in Durban, South Africa.
 |
Michel Jarraud has headed the WMO since 2004. (Photo courtesy WMO) |
"Our role is to provide the scientific knowledge to inform action by decision makers," said WMO Secretary-General Michel Jarraud. "Our science is solid and it proves unequivocally that the world is warming and that this warming is due to human activities," he said.
"Concentrations of greenhouse gases in the atmosphere have reached new highs," warned Jarraud. "They are very rapidly approaching levels consistent with a 2 to 2.4 degree Centigrade rise in average global temperatures, which scientists believe could trigger far reaching and irreversible changes in our Earth, biosphere and oceans."
Global temperatures in 2011 have not been as warm as the record-setting values seen in 2010 but have likely been warmer than any previous strong La Niña year, based on preliminary data compiled by the World Meteorological Organization.
The global combined sea surface and land surface air temperature for January-October 2011 is estimated at 0.41°C plus or minus 0.111°C (0.74°F plus or minus 0.20°F) above the 1961-1990 annual average of 14 degrees Celsius (57.2 degrees Fahrenheit).
The 10-year average for the period 2002-11, at 0.46 degrees Celsius above the long-term average, equals 2001-10 as the warmest 10-year period on record.
Final annual figures for 2011 will be available once November and December data are available in early 2012.
Global climate in 2011 was heavily influenced by the strong La Niña event which developed in the tropical Pacific in the second half of 2010 and continued until May 2011.
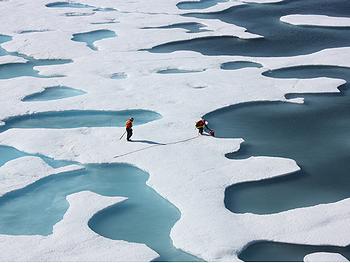 |
Sea ice melting in the Arctic Ocean, July 12, 2011 (Photo by Kathryn Hansen courtesy NASA) |
This event, which on most measures was one of the strongest of at least the last 60 years, was closely associated with many of the year's notable regional climate events, including drought in east Africa, the central equatorial Pacific and the southern United States, and flooding in southern Africa, eastern Australia and southern Asia.
Strong La Niña years are typically 0.10 to 0.15 degrees Celsius cooler than the years preceding and following them. 2011's global temperatures followed this pattern, being lower than those of 2010, but were still warmer than the most recent moderate to strong La Niña years.
La Niña conditions have redeveloped in recent weeks but are not expected to approach the intensity seen in late 2010 and early 2011.
Surface air temperatures were above the long-term average in 2011 over most land areas of the world.
The largest departures from average were over Russia, especially in northern Russia where January-October temperatures were about 4°C above average in places. The spring was especially warm in this region with some stations more than 9°C above average for the season, while European Russia had another hot summer - the third-hottest on record in Moscow - although not as extreme as that of 2010.
 |
Couple takes shelter from the record Helsinki heat in the shade of a wall, July 2011. (Photo by J. Mikael Siirilä) |
The hot summer conditions extended into other northern countries, with Helsinki, Finland having its hottest summer in nearly 200 years of data, and Armenia setting an all-time national record (43.7°C).
Spain has had its hottest January-October period on record and several other western European countries approached records.
January-October 2011 was 1°C or more above average over large parts of Europe, southwest Asia and northern and central Africa, as well as the southern United States and northern Mexico, most of eastern Canada, and Greenland.
The Central American region is on course to have its hottest year in at least 140 years.
The most significant area of below-normal temperatures in 2011 was in northern and central Australia where temperatures were up to 1°C below average in places, largely the result of above-average cloudiness and heavy rain early in the year.
Other regions to experience below-normal temperatures in 2011 included the western United States and south-western Canada, and parts of east Asia including the Indochina Peninsula, eastern China and the Korean Peninsula.
Flooding affected many parts of the world in 2011, both flash floods and longer-lived events. In terms of loss of life, the most extreme single event occurred in Brazil on January 11-12, when a flash flood, caused by rainfall which exceeded 200 millimeters in a few hours, in mountainous terrain about 60 kilometers north of Rio de Janeiro caused at least 900 deaths. This was one of the worst natural disasters in Brazil's history.
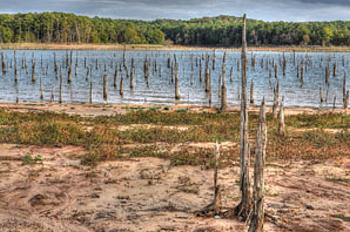 |
In southeast Texas, Sam Rayburn Lake was very low on November 27, 2011, exposing forested areas that were flooded when the Angelina River was dammed in 1965. (Photo by Sherry) |
It was a year of extremes in the United States, with 14 separate weather/climate events which caused losses of US$1 billion or more each.
Extreme drought affected parts of the southern United States and adjacent parts of northern Mexico. The core of the drought was in Texas, where state-wide averaged rainfall for January-October 2011 was 273 millimetres (56 percent below normal), well below the previous record of 327 millimeters set in 1956.
The drought region also had an exceptionally hot summer, with Texas's June through August mean temperatures (30.4°C (86.7°F), being 3.0°C (5.4°F) above the long-term average and the highest ever recorded for any American state. In addition to agricultural losses and water shortages, impacts of the drought included severe wildfires and dust storms.
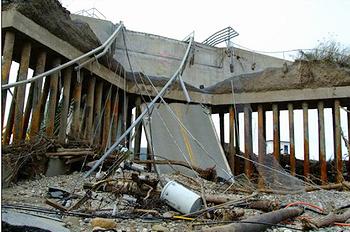 |
A bridge over New York's Mohawk River was destroyed by heavy flooding from Hurricane Irene and Tropical Storm Lee, August 2011. (Photo by Adam DuBrowa courtesy FEMA) |
Many northern and central parts of the United States experienced heavy rain and flooding in 2011. The January-October period was the wettest on record for several northeastern states and for the northeast region as a whole, with precipitation totals widely 30-50 percent above normal.
The most severe floods in this region, reaching record levels in places, were associated with Hurricane Irene in August and Tropical Storm Lee in September.
Spring and early summer were extremely wet in many central areas, particularly the Ohio Valley and the upper Midwest of the United States and the Prairie provinces of Canada, which experienced some of the worst flooding on record. There was also substantial spring flooding in the north-eastern United States and the Canadian province of Quebec. The heavy spring rains, combined with the melting of a heavy winter snowpack in northern areas, caused major downstream flooding during May and June. Parts of the Mississippi River experienced the worst floods since 1933, and there was also major flooding in the Missouri River and several Canadian rivers.
It was also one of the most active tornado seasons on record, with numerous major outbreaks, particularly in April and May. A tornado caused 157 deaths in Joplin, Missouri in May, the deadliest single tornado in the United States since 1947. To date, 2011 has had the third-greatest number of tornadoes since 1950, after 2004 and 2008, and 537 deaths, the fourth-greatest number of deaths on record. There were also a number of major snowstorms, including the most significant October snowstorm on record in the northeastern states.
This preliminary information for 2011 is based on climate data from networks of land-based weather and climate stations, ships and buoys, as well as satellites. The data are continuously collected and disseminated by the National Meteorological and Hydrological Services of the 189 governments that are Members of WMO and several collaborating research institutions. The content of the WMO statement is verified and peer-reviewed by experts from other international, regional and national climate institutions and centers before its publication.
Copyright Environment News Service (ENS) 2011. All rights reserved.