Network Monitors Water Quality in Shale Gas Drilling Region
High-pressure injection of water, sand and chemicals that fracture
shale deposits deep underground to free trapped natural gas is
employed by drillers tapping the Marcellus shale beds, a geologic
deposit that stretches from central New
York to Virginia and contains gas believed
to be worth hundreds of billions
of dollars.
The process, called hydraulic fracturing,
or fracking, has raised concerns
about possible impacts on water quality.
Tightly held “shale gas” like that in
the Marcellus shale deposits accounted
for 14 percent of the U.S. natural gas
supply in 2009, according to the U.S.
Energy Information Administration,
which expects the figure to grow to
45 percent of the nation’s gas by 2035
if current trends and policies remain
in place.

Hydraulic fracturing has been
practiced since 1949 and has become
extremely popular across the U.S. as gas
companies have increasingly focused
on hard-to-tap gas reserves, but little
information is available on its impact
on surface and ground water supplies.
The Susquehanna River Basin Commission
(SRBC), based in Harrisburg,
Penn., has established a 50-station
remote water quality monitoring network
to provide continuous, real-time
data on local streams and rivers in an
effort to determine whether fracking is
impacting water quality in the basin.
“There’s a lot of misinformation
and questions about transparency regarding
what’s happening out there in
the real world as far as Marcellus gas
drilling,” says Tom Beauduy, Deputy
Executive Director of the SRBC. “This
monitoring network provides an excellent opportunity to provide
the public with real data, and to serve as a sentinel for conditions
out there.”
Water-Intensive Process
To tap into shale gas in the Marcellus deposits, gas companies
drill vertical wells 5,000 to 9,000 feet deep, then turn their bits
horizontally for another 3,000 to 10,000 feet to maximize the
amount of shale each wellhead can reach. Steel casing surrounded
by cement is designed to isolate the well
from groundwater as the shaft travels
deep into the bedrock. When the well is
complete, explosive charges are pushed
to the horizontal portions of the well to
breach the casing and begin the fracturing
process. After the initial cracks
are made in the brittle shale, fracturing
fluid is pumped down the well at
high pressure to further pry open the
bedrock and free the gas.
Hydraulic fracturing is a waterintensive
process—3 to 5 million
gallons of frac fluid are typically used
to fracture the deposits reached by an
individual well. Of that solution, more
than 90 percent is water. Sand, which
props open the fissures in the fractured
deposit, comprises about 9 percent
of the mix. Each drilling company’s
proprietary blend of other ingredients,
which can range from mineral oil
lubricants to pH adjustors to biocides,
makes up the rest, accounting for 0.5
to 2 percent of the volume, according
to the U.S. Environmental Protection
Agency (EPA).
Most of the known ingredients in
frac fluid are relatively benign, notes
EPA, including products like mineral
oil, guar gum and citric acid. However,
others such as diesel fuel, ethylene
glycol, and the biocide glutaraldehyde
can present a significant environmental
concern—in the Marcellus wells, up to
10 percent of the frac fluid returns to
the surface within 30 days of injection
as “flowback.”
As many as 400 trucks serve a well during the fracturing process,
hauling frac fluid and produced water to and from the drill
pad. Wastewater ponds may also be constructed for temporary
storage. Both raise concerns over the danger of spills into local
streams, notes Andrew Gavin, Manager of SRBC’s Monitoring
and Protection Program.
Designing the Network
Building on SRBC’s experience with a drinking water quality
monitoring network established almost a decade ago, Gavin and
his colleagues developed a plan to deploy sondes—rugged probes
that collect and transmit information on water quality—for longterm,
continuous monitoring at 50 sites in the Susquehanna basin
where it overlies Marcellus shale in Pennsylvania and New York.
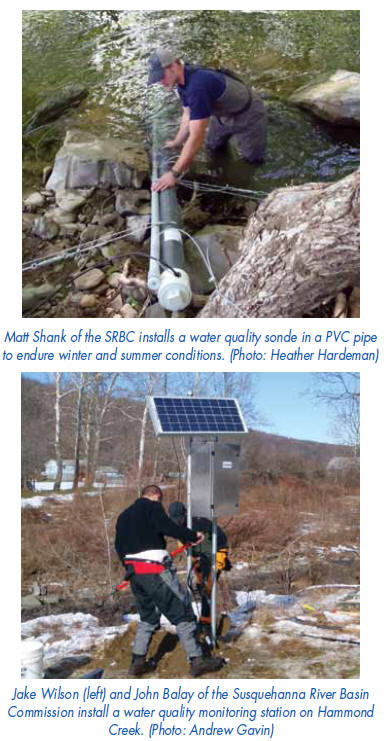
Each station consists of a YSI 6600 V2-4 multiparameter
sonde in a protective PVC housing tethered to the streambank
and connected to a data platform. Dataloggers are connected to
cell modems—or if a cell signal is unavailable, a satellite transmitter—
and powered by a solar panel.
Drillers have to disclose the contents of their long-secret
frac fluid formulations, but monitoring for specific contaminants
in the field is not viable. Instead, SRBC focused on monitoring
parameters that would indicate a likely spill of either a saline
solution or mineral-rich deep groundwater—temperature, conductance,
pH, dissolved oxygen (DO), and turbidity. Monitoring
those parameters as well as water level can also yield insight
on other phenomena such as acid rain or turbidity from storm
events, Gavin notes.
The Commission chose three types of monitoring sites, says
Gavin—streams close to existing wells or truck routes, reaches
where infrastructure and other conditions make it likely that
wells will be established nearby, and more pristine streams in
highly forested areas outside the expected drilling zones. Some
stations also monitor high-value watersheds such as municipal
water supplies or popular recreation areas. To take full advantage
of the chance to gather new data on local watersheds, the network
sites are located in areas not already covered by U.S. Geological
Survey monitoring efforts
The range of locations should provide a useful combination
of baseline data, evidence of changes, and insight into local stream
systems that have not been well-studied in the past, says Gavin.
The size of the watershed connected to each site was a critical
decision.
“In looking at some of the critical criteria for choosing
locations, the question became, ‘what would be the most likely
volume of a wastewater spill, leak or breach we’d be dealing
with?’” Gavin notes.
Breaches or leaks from wastewater storage ponds near wells
present a significant water quality threat. But smaller spills can
also be a problem. For instance, an average tanker truck carries
5,000 gallons. A spill of that size could easily be diluted in
a large watershed, or get flushed past a monitoring station so
quickly that it would be missed if the network protocols weren’t
established properly.
“We conducted bench tests with YSI equipment in the lab
A593 0811
Y S I Environmental Pure Data for a Healthy Planet.® Application Note
and simulated frac wastewater,” says Gavin. “We determined that
if we targeted watersheds no greater than 60 to 80 square miles,
they generally have flows where we could detect changes in water
quality if wastewater was introduced into the stream.” Most of
the monitored streams run below 100 cubic feet per second (cfs)
80 to 90 percent of the time, and flow in the single digits or teens
during low-flow conditions.
“We have all of our stations taking observations every five
minutes,” Gavin adds. “It goes back to what we defined as our
most probable scenario—a volume of 5,000 gallons carried in
a truck. With a plume of that concentration, we could detect at
least some part of it—the beginning, middle or end—within a
five-minute interval.”
If key parameters surpass normal levels, the station triggers
an alarm to prompt an investigation.
The system was put to the test in May 2010 when a wastewater
pit liner breached, releasing frac flowback water near Bob’s Creek
in western Pennsylvania. The drilling company reported the
breach to state officials, and SRBC paid special attention to data
coming from a sonde seven to eight miles downstream of the spill.
“We were pleased that it wasn’t a large volume, but we were
able to see a distinctive breakthrough curve,” Gavin says. You
could see the rise in conductance for about 24 hours, then the
fall as it moved through the system. In that sense, we had a little
test to see if we could pick up an event.”
Logistical Considerations
Some logistical considerations also have to be taken into account.
For instance, notes Gavin, stations must be situated so the
monitoring instruments stay submerged even during low-flow
conditions, and can be placed deep enough to stay below the
ice during the winter. The channel should also provide enough
flow to prevent leaves and sediment from building up around
the sonde, he adds.
Access is another big logistical concern. SRBC has built its
monitoring stations on both public and private land. Each has
its benefits and challenges.
Siting a station on public land is a simple matter of coordinating
with whichever state agency controls the property, though
Gavin notes that some state-owned areas were a bit too public,
raising concerns about vandalism in areas with heavier traffic.
Stations on private land can be more secure, but working with
landowners can have its challenges.
“You have to have private landowners agree to participate,”
notes Beauduy. “Several landowners stepped up immediately.
Others were concerned about the stations being near them, or
didn’t want people coming across their property.”
Reliability is Key
Every six to eight weeks, SRBC staff visit each monitoring
station to rotate the sonde with a lab-calibrated replacement, conduct
field calibration for the replacement instrument, and bring
the long-deployed sonde back to the lab for calibration, cleaning
and QA/QC before it’s redeployed at another station. Durability
and stability are key to making the system work smoothly.
“The YSI sondes have been very reliable, with even lower
maintenance needs than expected,” Gavin says. “They’re very
versatile and durable for field deployment. I was familiar with YSI
products from when I worked for USGS back in the early ‘90s,
and we had quite a comfort level with the company’s sondes from
our drinking water monitoring system back in 2003.”
During the regular maintenance visits, technicians also collect
water samples to be lab-tested for pH, chloride, barium, total
dissolved solids (TDS), sulfate and total organic carbon (TOC)
after each visit. Four times a year, water samples are collected
for a detailed analysis including calcium, magnesium, sodium,
potassium, nitrate, carbonate and bicarbonate alkalinity, carbon
dioxide, bromide, strontium, lithium, and gross alpha and beta—
a thorough workup that better characterizes the influence of
groundwater in the stream or indicates the presence or absence
of flowback wastewater. While on-site, the team also uses SonTek
FlowTrackers to measure stream flow.
Fresh Data ’Round the Clock
The sondes collect observations on a five-minute interval,
and transmit collected data to SRBC’s office every two to four
hours. Data is imported into SRBC’s database and within a few
minutes is posted without correction (and labeled “provisional”)
for public access at http://mdw.srbc.net/remotewaterquality/.
A year after the first stations went online, says Gavin, “we’re
at 10 million observations, but even at that level, the file size isn’t
that great. Analysis work is generating four-hour averages or
daily averages, and we’ll be running through corrections based
on calibration drift.”
After compiling the first year’s data, SRBC is getting ready
to release its first data summary. Gavin notes that more data will
be required to determine if and how fracking is affecting water
quality in the basin. However, a preliminary analysis shows great
baseline data for the station sites, and unexpected results from
some areas are prompting further study, he says.
“Some stations we’re keeping a closer eye on because of the
way the trends are—it may take more analysis to understand
what’s going on,” Gavin explains. “We’re also collecting supplemental
data on geochemistry—water samples for lab analyses—to
help characterize the natural conditions and put the continuous
data into context.”
A broad array of users has accessed the data. “We have everybody
from just your private citizen to locals who are part of
civic or watershed groups to those more specific citizen groups
organized around Marcellus,” says Gavin. “The state uses it as well
to keep an eye on conditions. The industry itself has been watching
the data. And there’s been a lot of interest from universities.”
The Commission posts a glossary of key water quality terms
and explanations on its web site, though Gavin says most visitors
to the network’s web site are familiar with water quality concepts
and what the data means.
Real-time data, long-term trend monitoring and spill
alarms will all be important in monitoring surface water in the
Susquehanna River Basin’s Marcellus shale region. But the ability
to collect long-term, continuous data and post it online for
the world to see takes the monitoring network to an even higher
level, says Beauduy.
“This is a way to provide value-added service to our member
commissions, especially on something that’s somewhat controversial,”
he says, “in a way that lets the science speak for itself and
lets the public have access to the data in a transparent manner.”
©2011 YSI Environmental +1 937 767 7241 Fax +1 937 767 9353 environmental@ysi.com www.ysi.com